
Defending direct demand through AI search
Investment, discovery and early results
AI Source and Zone added to Helium on 1 May 2026. Month 4 of a 12 month programme; in OmniHyper’s experience, AI search can take 6 to 9 months to show clearly in commercial results. May to August 2026 against May to August 2025.
THE INVESTMENT
Four months
Helium, AI Source and Zone running together from 1 May 2026, over an established organic search foundation.
Source: OmniHyper programme agreement.
WHAT CHANGED IN DISCOVERY
20.6 to 9.0
Average Google position on mobile, onto page one. Mobile delivers two thirds of search clicks; across all devices the average moved from 27.8 to 11.3.
43,624 impressions in Google’s Generative AI features, 18 May to 31 August 2026 (a new report, so no prior year comparison). Search click through rate up 34.6%.
Source: Google Search Console. The brand has direct access.
EARLY COMMERCIAL INDICATORS
+17.1%
August direct revenue year on year, the strongest August in the hotel’s reporting.
40.4% to 51.0%
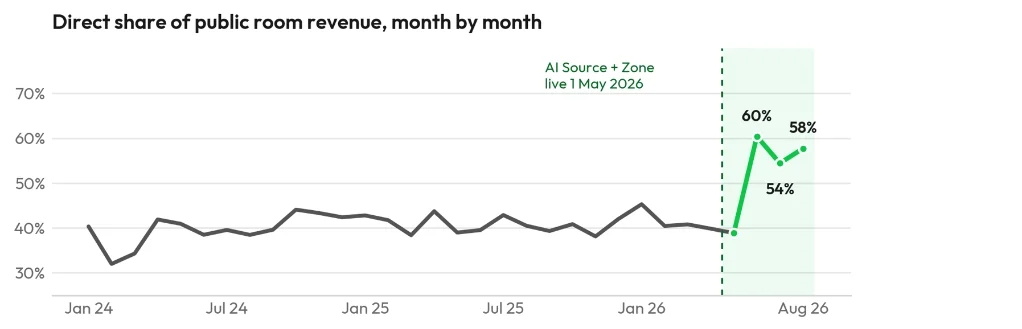
Direct share of public room revenue, May to August 2025 versus May to August 2026.
Full source: Defending Direct Demand Through AI Search – Perth CBD Hotel. Every claim sourced, with a claim-to-source map
Perth CBD Hotel
Scope: AI Search, organic search and hyperlocal search: AI Source, Zone and Helium
Measurement Period: 1 May 2026 to 31 August 2026, month 4 of a 12 month programme1
Hotel Context & Market Changes
Perth’s underlying demand was not the constraint across the measurement period. Google Trends indexed interest for “hotel perth” averaged 92 from May to August 2026 against 80 for the same months in 2025, and “accommodation perth” averaged 88 against 85.3 Horwath HTL, using STR data, records Perth RevPAR up 5.1% for the year to June 2026, with forecast supply growth of 1.9% a year to 2030.4 The hotel’s own trading reflects a firm market: average occupancy of 82.6% across the four months against 85.8% a year earlier, on ADR up 2.3%.5
What changed was where that demand is resolved. The property had already reached the point where traditional search success stopped protecting revenue. In the owners presentation of February 2026, traditional search rankings were up 57% and AI search traffic up 2,300%, yet web direct bookings for November 2025 to January 2026 fell 56% year on year and web direct revenue fell 48.8%.6 Rankings were strong and the revenue they used to deliver was not.
The same signature is visible in Google’s own data for the measurement period. Average position improved from 27.8, the third page of results, to 11.3, the top of page two, and to 9.0 on mobile, while total impressions fell 31.7% and clicks fell 7.9%.7 A hotel can rank better than it ever has and still be shown and clicked less often, a pattern consistent with AI generated answers and other result page features resolving more of the traveller’s question before they reach the hotel’s website. On the strength of the Helium track record the hotel acted on that reading and deployed AI Source Dominance and Zone over the top of Helium from 1 May 2026.8
The Challenge
- Traditional search success had stopped converting into direct revenue. Rankings and AI search traffic were both rising into early 2026 while web direct bookings fell 56% and web direct revenue fell 48.8% year on year over November 2025 to January 2026.6
- Visibility was being shown less and clicked less, not ranked worse. Over the measurement period impressions fell 31.7% and clicks fell 7.9% on an average position that improved by more than 16 places, a pattern consistent with more searches being resolved on the results page rather than on the hotel website.7
- AI answers often mentioned the brand without naming the property. When a Perth hotel recommendation came back as simply the brand name, the visibility was not credited to the property by name. In June, unnamed brand mentions took 3.4% share of voice in ChatGPT against 3.1% for the property by name, and on the four platform basis introduced in July the gap was 4.2% against 2.9%.9
- AI systems were describing the hotel using other people’s content. In July, TripAdvisor, Booking.com and Agoda supplied 1,592 citations about the property against 114 from its own domain, a ratio of fourteen to one, and a competing hotel group’s website was the fifth most cited source in the property’s own brand analysis.9
There was also a measurement problem underneath the commercial one. The two systems most often used to prove direct performance, Google Analytics on the hotel website and the brand’s attribution reports, both credit only the last click on a tracked session. As guests increasingly begin with an AI answer, continue through branded search and complete the booking on the brand’s central booking site, in a later session or by phone, those systems record less and less of what the hotel actually sells. The brand has acknowledged that these attribution reports have become unreliable.
The objective was therefore twofold: make the property the answer in AI assisted discovery and in hyperlocal search, and hold direct demand while the discovery layer that used to deliver it was being rebuilt around answers.
Approach
- Entity and structured data work. Hotel, Room, Amenity, FAQ, LocalBusiness and Offer schema were implemented and then consolidated into a single merged hotel block, supplied on 12 August, so that AI systems read one consistent description of the property. Defects that undermine machine reading were found and reported, including an incorrectly formatted star rating.10
- Answer led content. Existing pages were rewritten to answer the questions Perth travellers actually ask across dining, wellness, parking, transport, family stays and major arena events. July alone saw 32 pages created or substantially updated, including a new residential conferences page carrying valid FAQPage markup, now the longest page on the site.10
- Naming consistency. To help AI systems credit the hotel by name, the property’s full name was standardised across the site and the listings AI systems read. The homepage meta description, which had dropped the city from the name, was corrected and confirmed live on 12 August.10
- Hyperlocal visibility through Zone. Keyword and intent research, on page and technical optimisation for the local algorithm, and distribution of consistent property information across a network of 136 local channels integrated with the Google Business Profile, targeting “near me”, geo targeted and location enabled searches.11
- Measurement across the AI platforms. Monthly reporting by Mae, OmniHyper’s AI digital marketing agent, tracking share of voice, sentiment, mentions, average position and citation sources across ChatGPT, Perplexity, Gemini and Google AI Mode, alongside Google Analytics 4 and Google Search Console, with named actions owned by the hotel, the brand and OmniHyper.9
Observable Changes
- Search ranking moved from page three to page one on mobile. Average position improved from 27.8 to 11.3 on a like for like window, from page three to the top of page two. On mobile, which delivers two thirds of the site’s search clicks, it moved from 20.6 to 9.0, onto page one; on desktop from 34.0 to 14.3. The homepage improved from 24.9 to 8.2, the spa page from 32.5 to 15.2 and the Meetings & Events hub from 45.0 to 13.3.7
- The tracked keyword portfolio strengthened. 60 of 66 tracked keywords ranked at the end of the period, a net gain of 86 positions, or 120%, across the four months. The property holds first place on several non brand, street level local terms, with a core CBD accommodation term up 92 places into the top ten, a CBD hotel term up 77 places and a Perth conference venue term in the top five.12
- The pattern is consistent with more zero click search. Impressions fell 31.7% and clicks fell 7.9%, so click through rate rose from 2.34% to 3.15%, a 34.6% improvement. The site is converting a smaller pool of impressions into clicks far more efficiently.7
- AI surfaces became measurable for the first time. Google’s Generative AI features report records 43,624 impressions for the property between 18 May and 31 August 2026, rising from roughly 250 a day in late May to roughly 470 a day through August. The report is new, so no prior year comparison exists.13
- AI assistants are now a native, high quality channel in Google Analytics. The AI Assistant channel delivered 239 sessions, growing 49 in June to 76 in July to 114 in August, a 133% increase across the programme. Those sessions engage at 62.3% against 49.9% site wide, hold 1 minute 7 seconds of engagement against 33 seconds, and fire 8.67 events a session against 6.04. They produced 67 booking intent events, 28 per 100 sessions against 11 per 100 site wide.14
- AI referrals more than tripled. Sessions from AI platforms reached 332 against 102 a year earlier, up 225%, led by chatgpt.com at 316 sessions, up 226%, with claude.ai, Gemini, Perplexity, Copilot and OpenAI all present. Google Analytics recorded revenue against these sources for the first time, against nothing in the prior year.14
- Direct sessions rose as organic sessions fell. Direct grew 79.6%, from 2,885 to 5,182 sessions, while Organic Search fell 14.2%. Some AI assisted demand may sit inside that number. A guest recommended the hotel in an AI answer may research it there, then return by searching its name or typing its address; that visit is credited to Direct or brand search, even though the originating influence may have been the AI answer. Google Analytics also records as Direct visits it cannot attribute, including from AI apps that pass no referrer. How much of the increase these effects explain cannot be measured.14
- AI sentiment is consistently favourable. Sentiment scored 98% favourable on Google AI Mode in May, 82% on ChatGPT in June, 93% in July and 95% in August, with no unfavourable coverage recorded in July or August across 199 and 161 tracked mentions.9
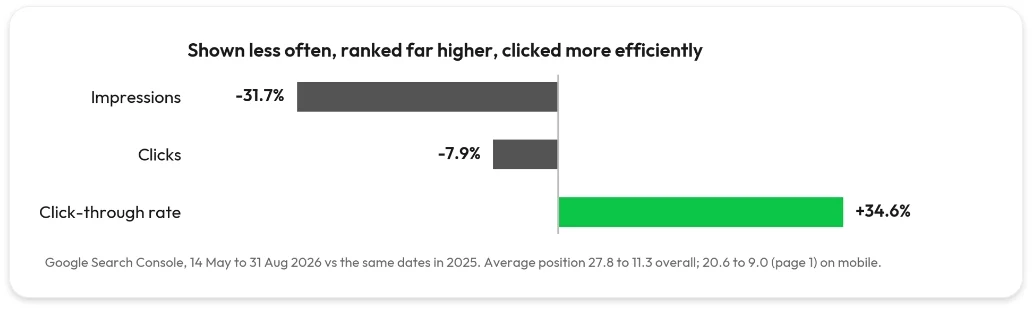
Figure 1: Year on year change in Google Search Console impressions, clicks and click through rate. Source: Google Search Console.
Commercial Indicators
Commercial outcomes are taken from the hotel’s own channel reporting, completed by the hotel’s revenue team independently of OmniHyper and of Google Analytics, and revised in September 2026.5
- The hotel deliberately gave more rooms to crew and corporate business. From June to August crew and corporate business made up a large and growing share of occupancy, and the hotel closes or restricts OTA channels on weekdays and outside school holidays when that base business is strong. Room nights outside the public segments rose by more than half, June to August 2026 against the same months in 2025.17
- Direct held while indirect was squeezed. Indirect room nights fell 36.3% and indirect revenue 41.0%. Direct room nights fell only 6.0% and direct revenue 9.4%. Direct’s share of public room revenue rose from 40.4% to 51.0%, a level not previously reached in any month since January 2024; that shift reflects the hotel’s channel strategy as much as guest demand and is not claimed as an AI Search outcome.5
- August was the strongest month of the programme. Direct revenue was up 17.1% year on year and the highest August in the hotel’s reporting, on direct room nights up 19.4%, in a month when substantially more rooms went to non-public business than a year earlier. The monthly trajectory runs from 5.2% down in May, 29.4% down in June and 17.8% down in July to 17.1% up in August, against 19.1% and 23.9% declines in March and April before activation.5
- Meetings and events grew. MICE revenue rose 17.4% year on year, with around two thirds of enquiries converting to bookings across the four months, the first period in which the hotel tracked enquiry conversion.5
- Rate held as the mix changed. ADR rose 2.3%, on average occupancy of 82.6% against 85.8%. Direct ADR now sits level with indirect ADR, where a year earlier direct sat below it.5
- The attribution systems moved the other way. The brand’s attribution reports recorded hotel website revenue down 70.0% and Google Maps revenue down 67.0%; Google Analytics recorded site revenue down 39.8% and key events down 32.1%.15 Google’s own record of what guests did on the hotel’s Business Profile fell far less: interactions down 9.6%, calls down 9.9% and direction requests down 4.6%, on profile views up 6.7%.16 A 67% fall in Maps revenue is not what guests did on Maps; it is what the last click could still see.
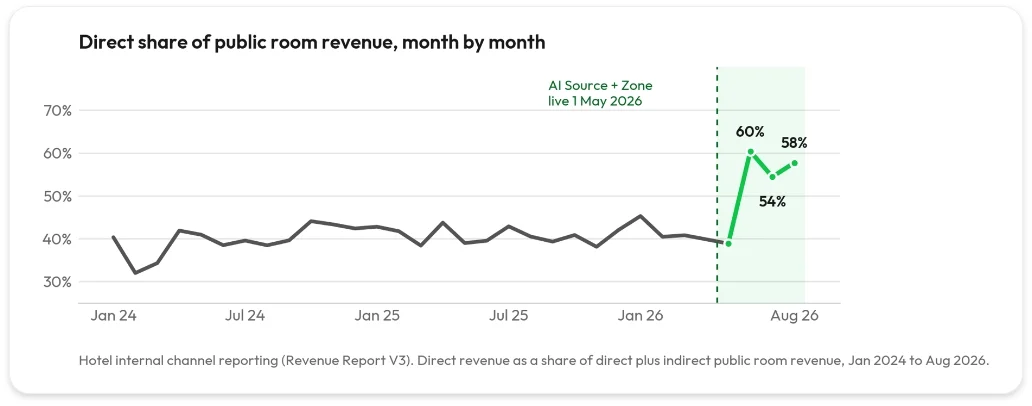
Figure 2: Direct revenue as a share of public room revenue by month, January 2024 to August 2026. From June the rise also reflects weekday OTA restrictions (note 17).
Source: hotel internal channel reporting.
Interpretation
In the first four months of AI Source and Zone, measurable AI visibility and search positioning improved, while the hotel’s direct channel showed increasing resilience by the end of the period despite having fewer rooms to offer the public. The evidence is consistent with the programme contributing to that resilience. It does not isolate causation, and this case study does not claim that it does.
It is also early. This is month four of a twelve month programme. In OmniHyper’s experience, AI search can take six to nine months to show clearly in commercial results. These figures are a first reading, not a verdict.
What is not claimed. Helium, AI Source and Zone ran together, alongside marketing by the hotel and the brand and a paid social campaign that stopped in August. From June the hotel took substantially more crew and corporate business and restricted OTA channels on weekdays to accommodate them, so most of the indirect decline and of the rise in direct share is a revenue management decision, not a search outcome.17 Local discovery did not improve: Google Business Profile search appearances fell 18.9% and booking link clicks 25.4%, and Zone’s contribution is not claimed here.16
The evidence chain
- The hotel entered the period with strong conventional rankings but falling web direct results.6
- AI Source and Zone were added to the existing Helium programme on 1 May 2026.8
- Mobile search moved onto page one, and Google recorded 43,624 impressions in its AI features.7
- Identifiable AI traffic engaged better than the site average and showed stronger booking intent.14
- Last click systems fell far more sharply than the hotel’s own direct revenue: brand attribution website revenue down 70%, direct revenue down 9.4%.15
- Direct revenue moved from 23.9% down in April to 17.1% up in August, while more rooms went to crew and corporate business.5
Together, these signals are consistent with an increasing share of discovery happening before, and outside, the final tracked session, so last click reporting is unlikely to capture the complete path to booking. A guest who shortlists the hotel in ChatGPT, then searches its name and books, is credited to brand or Direct, even though the originating influence may have been the AI answer.
Six separate data sources were used, four of which are controlled directly by Google, the brand or the hotel. Taken together, they show improving AI and search visibility, stronger engagement from identifiable AI traffic, declining last click attribution, and a direct channel that strengthened materially by the end of the period. That is credible early evidence, not proof of incremental revenue.
Appendix: Claim-to-Source Map
This case study was designed to minimise reliance on agency reported metrics. Wherever possible, outcomes are drawn from systems owned by Google, the brand or the hotel itself, so that every claim can be verified independently.
| # | Claim | Source | Window | Brand Access |
|---|---|---|---|---|
| 1 | Demand stable or growing: “hotel perth” interest 80 to 92; Perth RevPAR +5.1% YTD June 2026 | Google Trends; Horwath HTL / STR | May to Aug 2026 | Public |
| 2 | Rankings up, visibility down: average position 27.8 to 11.3 (mobile 20.6 to 9.0); impressions -31.7%; clicks -7.9%; CTR 2.34% to 3.15% | Google Search Console | 14 May to 31 Aug 2026 vs 2025 | Direct (Google property) |
| 3 | 60 of 66 keywords ranking; net +86 positions (+120%); first place on street level non brand terms | Rank Tracker via OmniHyper dashboard | 1 May to 31 Aug 2026 | Via dashboard |
| 4 | 43,624 impressions inside Google’s AI features; new report, no prior year comparison available | Google Search Console, Generative AI features | 18 May to 31 Aug 2026 | Direct (Google property) |
| 5 | AI Assistant channel 239 sessions, 49 to 76 to 114 by month; 62.3% engagement; 67 booking intent events | Google Analytics 4 | 1 May to 31 Aug 2026 vs prior | Direct (GA4 property) |
| 6 | AI referral sessions 332 vs 102 (+225%); chatgpt.com 316 (+226%); first recorded AI referral revenue vs none | Google Analytics 4, session source | 1 May to 31 Aug 2026 vs prior | Direct (GA4 property) |
| 7 | Direct sessions +79.6% (2,885 to 5,182), which may include AI assisted visits GA4 cannot attribute; Organic Search sessions -14.2% | Google Analytics 4 | 1 May to 31 Aug 2026 vs prior | Direct (GA4 property) |
| 8 | AI sentiment 82% to 98% favourable; no unfavourable coverage in July or August; gap between unnamed brand and named mentions 1.3 to 1.05 points | AI Source brand performance analyses (Mae), ChatGPT, Perplexity, Gemini, Google AI Mode | May to Aug 2026 | Reported by OmniHyper |
| 9 | Direct revenue -9.4% vs indirect -41.0%; direct share 40.4% to 51.0%, partly reflecting OTA restrictions (row 14); direct room nights -6.0% vs indirect -36.3% | Hotel internal channel reporting | 1 May to 31 Aug 2026 vs prior | Hotel / brand internal |
| 10 | August direct revenue +17.1% and direct room nights +19.4%, the strongest August in the hotel’s reporting | Hotel internal channel reporting | Aug 2026 vs Aug 2025 | Hotel / brand internal |
| 11 | MICE revenue +17.4%; around two thirds of enquiries converted | Hotel internal channel reporting | 1 May to 31 Aug 2026 vs prior | Hotel / brand internal |
| 12 | Last click paradox: brand attribution website revenue -70.0%, Google Maps -67.0%; GA4 revenue -39.8% and key events -32.1% | Brand attribution reports; Google Analytics 4 | 1 May to 31 Aug 2026 vs prior | Brand internal; GA4 direct |
| 13 | Local discovery: profile views +6.7%; search appearances -18.9%; interactions -9.6% (calls -9.9%, directions -4.6%, website clicks -22.5%, booking clicks -25.4%) | Google Business Profile, Performance | May to Aug 2026 vs 2025 | Direct (Google property) |
| 14 | Crew and corporate a large and growing share of occupancy; OTA channels closed or restricted on weekdays; non-public room nights up by more than half | Hotel revenue management; derived from hotel channel reporting | Jun to Aug 2026 vs 2025 | Hotel / brand internal |
Every source above is either publicly reproducible or accessible to the brand and the hotel without reliance on OmniHyper, with the single exception of the AI platform brand analyses, which are produced inside the AI Source programme. Search and analytics figures can be verified in the property’s own Google Search Console and Google Analytics 4 properties; commercial figures can be verified in the hotel’s revenue reporting.